Send To options
You can send a copy of a chart, dashboard, individual dashboard control, or desktop to a file or to another program
Send To options only display in the menu when you have an item such as a chart open on the GainSeeker Charts window.
 Note: To send an item to Microsoft PowerPoint, Word, or Excel, these programs must be installed on your workstation.
You can access the Send To  options using the:
- GainSeeker Charts window File menu
-or-
-
Right-click menus for charts and dashboards
-or-
-
Send To button on the GainSeeker Charts toolbar
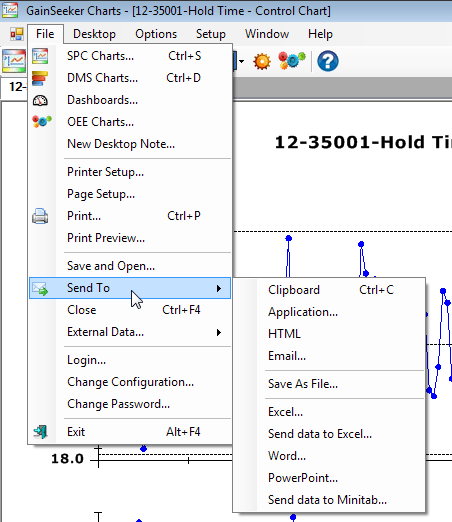
To open the Send To options using the File menu:
- Click the File menu on the GainSeeker Charts window. Point to Send To on the menu and click an option on the submenu that displays:
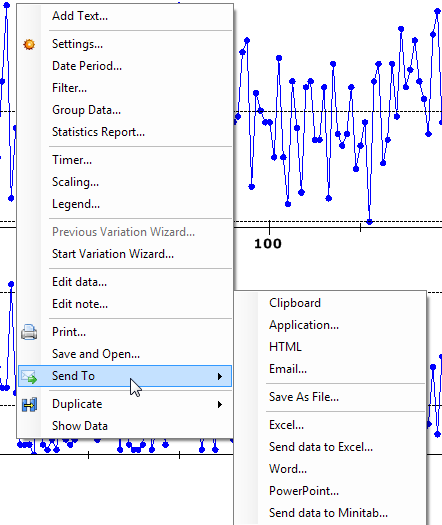
To open the Send To options using the right-click menu:
- Right-click on a window (a chart window, for example) that is open on the GainSeeker Charts window. Then, point to Send To and click an option on that submenu that displays:
To open the Send To options using the GainSeeker Charts toolbar:
- Click the Send To toolbar button on the menu and click an option on the submenu that displays.

Note: This toolbar button provides only a limited set of options that apply to all chart types. For a complete list of Send To options, use one of the other methods to send a chart (File menu or right-click menu).
Send To options may vary between chart and retrieval types.
Send To options
Many of these Send to options are only available if the user has permission to Send To >> Printer Or Editor.
Some of these options are not available for all GainSeeker Charts items.
Send Control to
Allows you to send a dashboard control (some types) to the Clipboard, an Application, HTML, Email, Word (or a text editor such as Notepad), PowerPoint, Excel, or Save as [a] File. Options may vary depending on the type of dashboard control.
Send to Clipboard
Sends an image of the chart, dashboard, or desktop to the clipboard, which you can paste into another application such as Microsoft Word.
Send to Application
Allows you to save the file as an image, *.htm, or *.rtf file, then send the file to a program or an executable file.
Send to HTML
Sends an image of the chart, dashboard, or dashboard control to your default browser.
Send to Email
Allows you to send an email containing an image of the chart, dashboard, or desktop along with a text file detailing the data.
- See Sending to Email
Save As File
Allows you to save the selected window contents to an image, *.rtf, or *.htm file.
Send to Excel
Sends data from a data table or statistics list to Microsoft Excel, which opens a spreadsheet containing that information. If you have a chart open and select this option, the statistics report and group information for that chart will open in an Excel spreadsheet.
- You can send data from a chart to an Excel spreadsheet using another option. See Send data to Excel... within this topic for more information.
Note: Microsoft Excel must be installed on your workstation for this to work.
Send data to Excel
Sends specific or all columns you select from the data table behind a chart to Microsoft Excel. An Excel spreadsheet then opens containing that chart information.
Note: Microsoft Excel must be installed on your workstation for this to work.
Send to Word
Opens an image or a text file of the contents of a selected window (a chart or dashboard, or all items on a desktop) in a Microsoft Word document. If you do not have Word installed on your workstation, GainSeeker sends it to the WordPad program installed with your Windows operating system.
Note: As of the release of Window 11, WordPad is no longer installed with Windows. If WordPad is not installed on a workstation, it will load the .RTF file with the application associated with .rtf extensions.
Send to PowerPoint
Sends an image of a chart, dashboard, or desktop images to Microsoft PowerPoint. (For statistic lists and tables, data text is sent to PowerPoint.) Then, the image automatically opens on a PowerPoint presentation slide as part of a new presentation.
Note: Microsoft PowerPoint must be installed on your workstation for this to work.
Send to Power BI
Sends any chart's data to Microsoft Power BI. This option is available for the following dashboard controls: Dashboard DataTable (both SPC and DMS), Dashboard Grid (both SPC and DMS), Big Data (both SPC and DMS), Paired Sample Grid, and Defect Trend Wizard. For more details, see Sending Charts to Power BI.
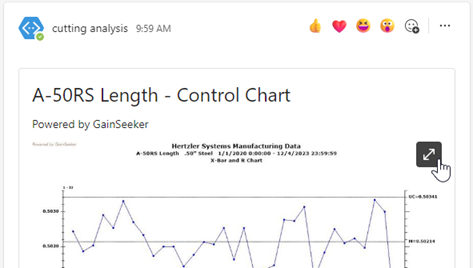
Send to Microsoft Teams
Posts an image of the chart or dashboard, or a table of statistics or data, in the Microsoft Teams channels you select. (Teams channels must be set up in the configuration.)
You can also add a heading text and message text before posting the information to Microsoft Teams.
Note: Charts and Dashboards may be reduced in size to fit the width or size requirements of a Teams post. For best results:
-
Make sure the chart or dashboard window is large enough to read before sending it to Microsoft Teams.
-
If possible, drag the edge of the chart or dashboard window to be large and to be square or tall (not wide).
-
If you need to enlarge the image in Microsoft Teams, click the Enlarge button on the image and then click the Zoom In and Zoom Out buttons.
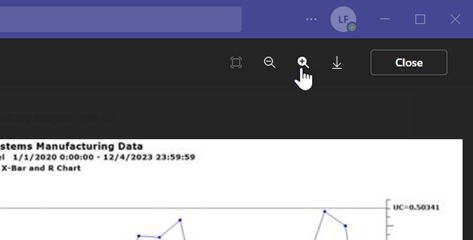
Note: Microsoft Teams tools to download or copy an image from a post may not work correctly for GainSeeker posts. This is a limitation of Microsoft Teams.
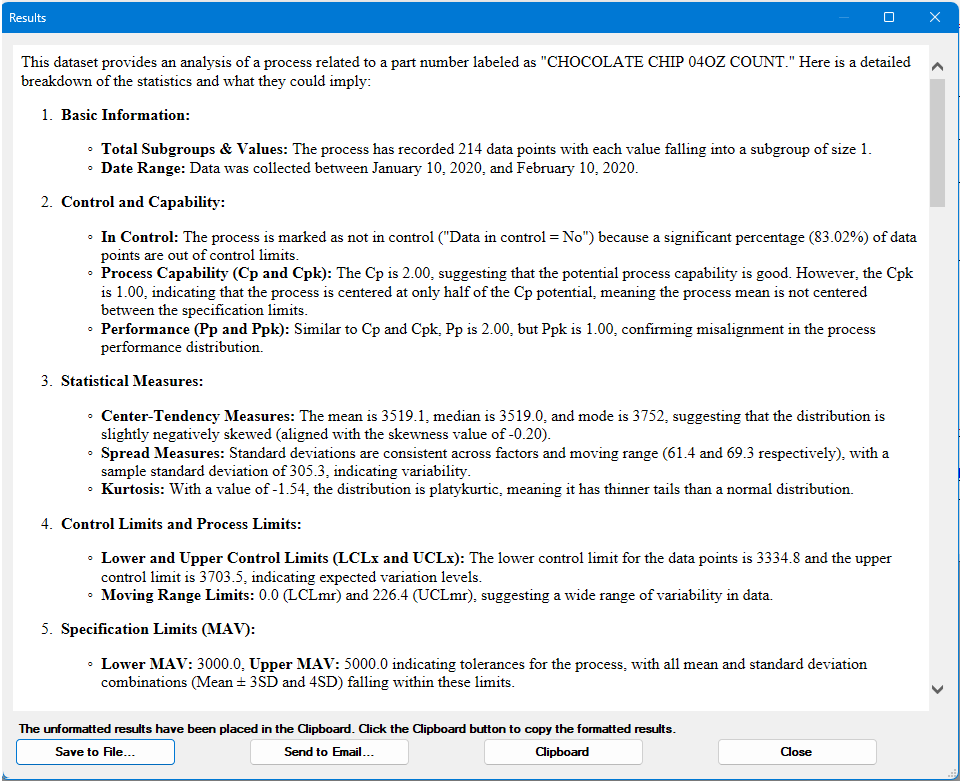
Send to Artificial Intelligence (AI)
Posts a defined set of statistics for the current chart to an Artificial Intelligence (AI) website for analysis. The AI website link must be defined in the System-wide settings section on the Configuration tab of the Administration module. If more than one AI link is defined, the user will be asked to select which AI link to use. The prompt for the selected link is displayed at the bottom of the dialog and can be changed temporarily before sending. The user may choose to append the prompt and/or the statistics that were sent to the website to the end of the results by using the Append prompt to AI results and Append statistics to AI results checkboxes. The user must have Send To AI rights in their Role.
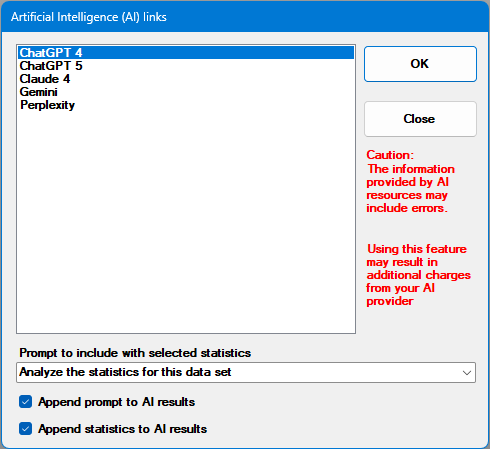
The results of the AI analysis are copied to the clipboard and displayed on a dialog. The dialog allows the user to save the results to a HTML file or share via email.