General Improvements for Version 8.0
New Dynamic Reports module
The new Dynamic Reports module allows you to create highly customized reports. It is similar to Crystal Reports®.
Like the Report Writer in the SPC Charts and Reports and DMS Charts and Reports modules, the Dynamic Reports module lets you combine raw data, statistics, and/or images in a single report. This is useful for generating common reports such as a Certificate of Analysis.
However, the Dynamic Reports module also gives you many additional capabilities for customizing reports, such as:
including data from a custom query on the current database connection
including data retrieved from other data sources
performing mathematical functions
user interaction with finished reports
executing Visual Basic code
complete control over layout, colors and fonts
and many other options
Hertzler Systems can provide training classes and other services to help you use these advanced capabilities to your advantage.
Server Edition now extended beyond Enterprise Dashboard
In previous versions of GainSeeker, it was possible to purchase a Server Edition of the Enterprise Dashboard module to easily share dashboards with people who may not have access to GainSeeker.
This functionality is now extended to the new Dynamic Reports module, and this additional license is now known as the Server Edition of GainSeeker.
For information on Server Edition options for the Dynamic Reports module, see Parameters to print or export a dynamic report. For information on Server Edition options for Enterprise Dashboards, see Server Edition options for Dashboards.
New .Launch module
The new .Launch module allows you to launch multiple GainSeeker modules from a single login.
If you have purchased a license for this module, you can easily set up shortcuts to perform automatic functions in GainSeeker modules.
You can also include shortcuts to other programs, files and web addresses, and you can organize these shortcuts in groups.
For details, see Launching GainSeeker modules from the .Launch module.
Enterprise Dashboard enhancements
Sparklines and Control Charts now available on Dashboards
Real-time failure dashboards and Statistical Filter dashboards for variable data can now include sparkline charts (run charts) and control charts. This makes it easy to visualize how your process is performing over time.
KPI gage dashboards can now display pictures, documents and web pages
In addition to Dial gages, Bar gages, Dynamic text and Static text, you can now add File or URL items to KPI gage dashboards.
This new type of item allows you to display pictures, documents, and web pages on KPI gage dashboards. It also makes it possible to display any type of GainSeeker chart - including Pareto charts, Box and Whisker charts, etc. - on a KPI gage dashboard.
For more information, see Specifying a File or URL.
New ability to automatically run a template before opening a Dashboard
In previous versions, the Server Edition of GainSeeker allowed you to perform one or more functions after a dashboard was opened or refreshed.
With this release of GainSeeker, the Server Edition also allows you to run a template before a dashboard opens or refreshes. This new functionality makes it possible to enter the most recent data into GainSeeker just before the dashboard is displayed. You could also use this feature to calculate one component of the dashboard from the value of another component of the dashboard. For more information, see Run a template before dashboard opens or refreshes.
Short Run analysis now available in Enterprise Dashboard module
The Enterprise Dashboard module now performs Short Run analysis of variable data dashboards where rows are sorted by a traceability field instead of the Part Number or Process fields. For KPI gages, Short Run analysis is used when the retrieval is based on a process specification instead of a Part Number (standard). For more information, see Using Dashboards to monitor your processes.
Cost chart now available
A new Cost chart has been added to the DPU chart options in the DMS Charts and Reports module. It can display the cost of defects or defective units over time.
Cumulative Yield now calculated for attribute data
A Cumulative
Yield statistic can now be reported for attribute data. This new statistic
is calculated as ![]() and is particularly useful when you retrieve and analyze data from multiple
processes.
and is particularly useful when you retrieve and analyze data from multiple
processes.
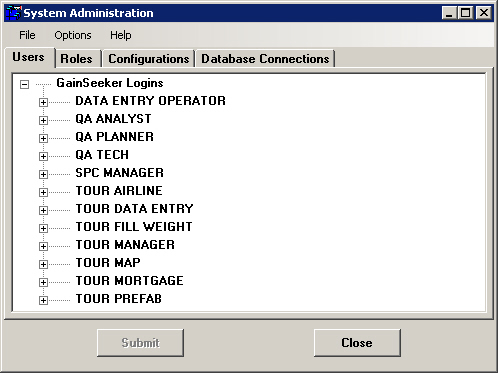
Administration module redesigned
The Administration module has been redesigned. Some of the new features that were added during the re-design include:
Reserving a GainSeeker license for a specific user name
Configuring default settings for SPC standards and for DMS standards
For details, see Viewing and changing settings, Submitting or Cancelling changes, Configuring GainSeeker and Checking Data Integrity.
GainSeeker Installation redesigned
The GainSeeker installation program has been completely redesigned.
Previous versions of GainSeeker were typically installed with program files (*.exe) stored on an Application Server. Beginning with GainSeeker version 8.0, these program files are now installed on the local drive of each GainSeeker workstation.
Other changes include the following:
The GainSeeker installation program now supports the use of file paths expressed in the Universal Naming Convention (UNC) format. Any file path that GainSeeker needs to use, such as those specified in the Administration module, can now be expressed in UNC format.
There is no longer a GainSeeker client installation program or a GainSeeker workstation update program.
Because there is no longer a GainSeeker client installation program, the Cms.net file is no longer used by GainSeeker.
Strong encryption for passwords now available
You can now generate a strongly encrypted version of a GainSeeker password or database password, using a 128-bit encryption method. This is useful when you want to specify a password in shortcuts that automate functions, Cms.ini files that connect to a non-default data source, or SPC data entry templates that connect to an external database – without the possibility for users to discover what that password is. For details, see Password Encryption utility.
New standards defined for implementing OEE metrics
Overall equipment effectiveness (OEE) is a metric that indicates how effectively a manufacturing operation is utilized. It is generally reported as a percentage and is the product of % Availability * % Performance * % Quality.
With GainSeeker version 8, Hertzler Systems has defined a unified standard for deploying OEE within GainSeeker Suite. The new standards include
DMS processes, defect lists and standards
SPC standards
Standardized data entry processes
Standardized dashboards and desktops like the following examples:
For information on using GainSeeker for OEE metrics, please contact the Sales department at Hertzler Systems.
Other improvements
New tables and files
Some new tables and files are used in GainSeeker version 8:
item in previous version: |
replaced by: |
database table: CFG database table: HSITABLE database table: USERPROF database table: USER_AUX database table: HIL file: Table.db file: SPC.db file: DMS.db file: Event.db file: Short_s.prf file: Short_d.prf file: Statlbl.prf file: Statlbld.prf |
new database table: HSICFG |
database tables: UC* file: CpOPC.dat file: CpDSE.dat |
new database table: HSIUC |
file: Sngs.dat |
new file: Settings.hsi |
new in version 8 |
new database table: HSIRPT new file: Redirect.hsi |
For a full list of tables and supporting files, see Tables used in GainSeeker 8.
The TABLE command has also been updated with these new table names.
|
UNC file paths now supported
The GainSeeker installation program now supports the use of file paths expressed in the Universal Naming Convention (UNC) format. Any file path that GainSeeker needs to use, such as those specified in the Administration module, can now be expressed in UNC format.
SPC Charts and Reports
A new command line parameter now allows you to create a shortcut which will open a desktop and save it to HTML without launching a web browser. For details, see Parameters to open a desktop and save as HTML.
Statistical changes for SPC and DMS
The default labels for some of the SPC and DMS statistics were updated for consistency and clarity. For a current list all statistics and their default labels, see SPC statistics available and DMS statistics available.
Also, a long list of minor statistical changes for SPC and DMS were implemented in this release of GainSeeker. To view the full list, click hereclick here.
The following statistics now report "Yes" or "No" instead of "True" or "False"
SPC 200 - Lower control limit cannot be less than zero
SPC 259 - Varying subgroup sizes found
DMS 300 - Sample size constant
DMS 302 - Exclude outliers
DMS 303 - Standardized
DMS 321 - Chart in control
The following statistics use 2 for number of decimals (these are all percent stats):
SPC 40 - Offset percentage
SPC 68 - Above spec actual
SPC 69 - Below spec actual
SPC 70 - In spec actual
SPC 71 - Out of spec actual
SPC 79 - Below spec predicted
SPC 80 - Above spec predicted
SPC 81 - Out of spec predicted
SPC 82 - In spec predicted
SPC 163 - Percent above control
SPC 164 - Percent below control
SPC 165 - Percent out of control
SPC 166 - Percent in control
SPC 167 - Percent above gate
SPC 168 - Percent below gate
SPC 169 - Percent outside gate
SPC 170 - Percent inside gate
SPC 188 - Percent within 1 sigma
SPC 189 - Percent within 2 sigma
SPC 214 - Percent above target
SPC 216 - Percent below target
SPC 249 - Percent above ind. lim
SPC 250 - Percent below ind. lim
SPC 251 - Percent outside ind. lim
SPC 252 - Percent inside ind. lim
SPC 253 - Percent above lower ind. lim
SPC 254 - Percent below upper ind. lim
SPC 255 - Percent above lower spec
SPC 256 - Percent below upper spec
SPC 257 - Percent above lower gate
SPC 258 - Percent below upper gate
DMS 317 - % above Control
DMS 308 - % above Gate
DMS 318 - % below Control
DMS 309 - % below Gate
DMS 21 - % Defects
DMS 22 - % good samples
DMS 35 - % good Units
DMS 319 - % in Control
DMS 310 - % in Gate
DMS 34 - % NCU
DMS 320 - % out of Control
DMS 311 - % out of Gate
DMS 15 - % zero values
DMS 37 - Yield
The following statistics now report 'Not set' instead of 'None set':
SPC 13 - Filter
SPC 14 - Filter content
The following statistics now report 'Not Set' instead of 'Not set'
DMS 4 - Filter content
DMS 5 - Filter
The following statistic is now reported in scientific notation
SPC 114 - Non-normal Area
The following statistic is now reports 'Multi-Variate Distribution" instead of 'Multi-Variate Distrib.'
SPC 117 - Distribution
The following statistics now report 0 instead of NA when no data found:
SPC 233 - Bypassed pieces
SPC 234 - Bypassed subgroups
The following statistics now report 'NA' instead of 'U' or ' '
SPC 90 - Mean + 3SD within spec
SPC 91 - Mean - 3SD within spec
SPC 92 - Mean + 4SD within spec
SPC 93 - Mean - 4SD within spec
The following statistic now reports 'Yes' or 'No' instead of a number
SPC 197 - Limit non-normal slices (Was Maximum slices)
The following statistics are affected by control chart scaling (This did not change and may be documented elsewhere)
DMS 315 - Maximum included
DMS 016 - Maximum value
DMS 314 - Mean
DMS 316 - Minimum included
DMS 017 - Minimum value
DMS 312 - LCL
DMS 313 - UCL
DMS 304 - Lower Gate
DMS 305 - Upper Gate
DMS Max/Min statistics:
Charts & Reports / Enterprise Dashboard: - Pareto retrieval
Maximum included = NA
Maximum value = count for maximum pareto category
Mean = NA
Minimum included = NA
Minimum value = count for minimum pareto category
Charts & Reports / Enterprise Dashboard: - DPU retrieval
Maximum included = NA
Maximum value = dpm for maximum dpu group
Mean = NA
Minimum included = NA
Minimum value = dpm for minimum dpu group
Charts & Reports / Enterprise Dashboard: - Control retrieval
Maximum included = Value of highest included point (scaled)
Maximum value = Value of highest retrieved point (scaled)
Mean = Average of included values (scaled)
Minimum included = Value of lowest included point (scaled)
Minimum value = Value of lowest retrieved point (scaled)
Dynamic Reports: No restriction for retrieval type
Maximum included = Value of highest included control point (scaled)
Maximum value = Value of highest retrieved control point (scaled)
Mean = Average of included control values (scaled)
Minimum included = Value of lowest included control point (scaled)
Minimum value = Value of lowest retrieved control point (scaled)
Maximum pareto category = count for maximum pareto category
Minimum pareto category = count for minimum pareto category
Maximum DPU group = dpm for maximum dpu group
Minimum DPU group = dpm for minimum dpu group
The following statistic may report different cost values in old (Charts & Reports / Enterprise Dashboard) and new (Dynamic Reports) systems
DMS 19 - Total defect cost
If you choose 'cost information from the defect list', both values will be the same.
If you choose 'cost information from the standard list', the old system will report total ncu cost and the new system will report total defect cost.
If you choose 'bypass cost', the old system will report NA and the new system will report total defect cost>
(The Dynamic Reports module does not make you choose where the cost information comes from.)
The following statistics do not apply to the .Net Statistics engine (used by the Dynamic Reports module):
SPC 204 - CuSum acceptance constant
DMS 26 - Chart type
We get a data set and return pareto, dpu or control stats as we are able.
In the old code, if you chose to draw a pareto chart and then displayed all statistics, any stats for dpu and control charts would be reported as NA.
In the new system, many of these will have values.
The following statistics are replaced in the .Net Statistics engine (used by the Dynamic Reports module):
Stat removed --> replaced with
SPC 25 R-Bar ind --> 24 R-Bar
SPC 28 Range SD ind --> 29 SD (range)
SPC 57 Maximum ind r --> 53 Maximum r
SPC 58 Minimum ind r --> 54 Minimum r
SPC 76 Max good ind r --> 62 Maximum r included
SPC 77 Min good ind r --> 63 Minimum r included
SPC 78 Median good ind r --> 64 Median r included
SPC 104 LCLx ind --> 100 LCLx
SPC 105 UCLx ind --> 101 UCLx
SPC 106 LCLr ind --> 102 LCLr
SPC 107 UCLr ind --> 103 UCLr
SPC 109 LCLx ind for zones --> 108 LCLx for zones
SPC 145 Ind crosses at --> 144 Trend crosses at
SPC 146 Correlation coefficient ind --> 140 Trend correlation coefficient
SPC 147 Trend line ind --> 141 Trend line
SPC 148 Slope ind --> 142 Trend slope
SPC 149 Y-intercept ind --> 143 Trend Y-intercept
SPC 154 Trend line UCLx ind --> 150 Trend UCLx
SPC 155 Trend line LCLx ind --> 151 Trend LCLx
SPC 156 Y-intercept UCLX ind --> 152 Trend Y-intercept UCLX
SPC 157 Y-intercept LCLX ind --> 153 Trend Y-intercept LCLX
SPC 178 EWMA UCLx ind --> 176 EWMA UCLx
SPC 179 EWMA LCLx ind --> 177 EWMA LCLx
SPC 243 Max ind r not bypassed --> 239 Maximum r not bypassed
SPC 244 Min ind r not bypassed --> 240 Minimum r not bypassed
New stats
SPC 208 - Date period *
SPC 209 - SQL query statement *
SPC 267 - Non-symmetrical control limits *
SPC 268 - Add groups for varying subgroup sizes *
SPC 269 - Group data *
SPC 270 - Runs based on *
SPC 271 - Exclude varying subgroup size (percent) *
SPC 272 - Exclude varying subgroup size (degrees of freedom) *
SPC 273 - Standardize data *
SPC 274 - Amount of time to display *
SPC 275 - Force distribution *
SPC 276 - Use 95% probability for non-normal calculation *
SPC 277 - Trend chart limits *
SPC 278 - EWMA weight *
SPC 279 - Default real-time checks *
SPC 280 - Standard flags **
SPC 281 - Short Run index **
SPC 282 - Use exponent **
SPC 283 - Missing subgroups
SPC 284 - Missing values
SPC 285 - No data found
SPC 286 - Subgroup SD
SPC 287 - Count above spec predicted
SPC 288 - Count below spec predicted
SPC 289 - Count in spec predicted
SPC 290 - Count out of spec predicted
SPC 291 - Count above ind. lim
SPC 292 - Count below ind. lim
SPC 293 - Count in ind. lim
SPC 294 - Count out of ind. lim
SPC 295 - Count above gate
SPC 296 - Count below gate
SPC 297 - Count in gate
SPC 298 - Count out of gate
SPC 299 - Count subgroups within 1 sigma
SPC 300 - Count subgroups within 3 sigma
SPC 301 - CuSum acceptance limit type *
SPC 302 - Insufficient non-normal resolution
SPC 303 - Exclude varying subgroup size (all) *
SPC 304 - Sigma level
DMS 51 - Cumulative yield
DMS 62 - Amount of time to display *
DMS 56 - Decimal places *
DMS 57 - Decimal places for cost *
DMS 54 - Date period *
DMS 52 - Description **
DMS 63 - Memo **
DMS 53 - Standard Sample size **
DMS 55 - SQL query statement
DMS 101 - Maximum pareto category
DMS 102 - Minimum pareto category
DMS 204 - Maximum DPU group
DMS 205 - Minimum DPU group
DMS 64 - Sum NCU
DMS 65 - Total Units
DMS 58 - DPM best estimate *
DMS 59 - DPM conservative *
DMS 60 - DPM no zero *
DMS 61 - Show empty bars *
DMS 400 - StatKey
DMS 324 - Default data type *
DMS 325 - Scale control data *
* - configuration or retrieval setting
** - standard setting
Multiple export and import file types now available for the SPC Standard Utility
Previous versions of GainSeeker only allowed you to export and import standards using the custom .std file format. The SPC Standard Utility now supports two new file formats for exporting and importing standards and Short Run process specifications: tab-delimited format (*.tab files) and XML format (.xml files). The .tab format is easier to use if you need to enter values for new standards with a program like Microsoft Excel which can create or edit files in this format.
SPC Designer - new and updated features
New features:
The new TRACE_MR command makes it easier to retrieve all of the traceability values that were most recently entered for a particular machine, line, user, or other traceability field.
The new DE_OPT 29 command allows you to read the contents of a web page that is displayed on the chart window for a row of the template. This command is typically used in conjunction with a timer to read user input and/or button clicks from an HTML file displayed in a data entry chart window.
The new TEXT_OPT 3 command allows you to change the label on the external applications button or hide the button.
The new MAV command returns the “Maximum Allowable Variation” (MAV) for the label weight you specify. The MAV value comes from tables in Fourth Edition NIST Handbook 133 (2005), Appendix A.
The new LOOP and LOOP_BREAK commands give you a much faster way to repeatedly execute the formula string you specify.
The new LIST_OPT 11 and LIST_OPT 12 commands allow you to specify the location of lists generated by the LIST_F, LIST_P, and LIST_Q commands.
The new RT_NOTE command launches the real-time failure note window for the specified template row. It uses the color, message and sound that you specify, and it uses the DE_OPT 6 setting for forcing the user to choose a corrective action.
The new MISC_INFO 5 - MISC_INFO 8 commands will return some of the User-Defined Labels from the current configuration.
The new OPC_OPT command can be used to enable an OPC receive buffer so that each time the value of an OPC channel changes, that channel number and value will be added to the queue in the OPC receive buffer. Then you can use the new OPC_RCVBUFFER to read each channel/value pair from the queue.
Updated features:
In previous versions, the DB_INSERT command would automatically increment the "DateTime" in the record buffer by one or more seconds if DMS data with the same standard and date/time stamp already existed in the database. This was true even if DMS was configured to display time to seconds or to hundredths of seconds.
This command now uses the Show time to configuration setting to determine the unit of time that will be used to increment the "DateTime" – Minutes, Seconds or Hundredths of seconds.
The help topics for CHT_OPT_SPC and CHT_OPT_DMS have been updated to indicate which settings will be ignored when retrieving a desktop.
The CHT_OPT_DASH and CHT_DASH commands have been updated such that when CHT_DASH is used to retrieve a desktop, any CHT_OPT_DASH commands that were used to specify a date period or a filter will be ignored. This makes retrieval of Enterprise Dashboard desktops work the same way that retrieval of SPC desktops and DMS desktops has worked from the beginning.
These commands have also been updated such that when CHT_DASH is used to retrieve a dashboard, the default date period is the date period defined in the dashboard (instead of the date period currently being used for SPC Data Entry) and the default filter is the filter defined in the dashboard (instead of traceability filters set for the current template row by the FILTER command).
|
The DATE_CHK command has been updated to correctly evaluate time stamps that are presented in 12-hour format followed by "AM" or "PM".
The help topic for the FREN command was updated to mention that this command can be used to move a file from one folder to another.
On Template Wizard Step 6, the Document tab can now support .docx files.
More: